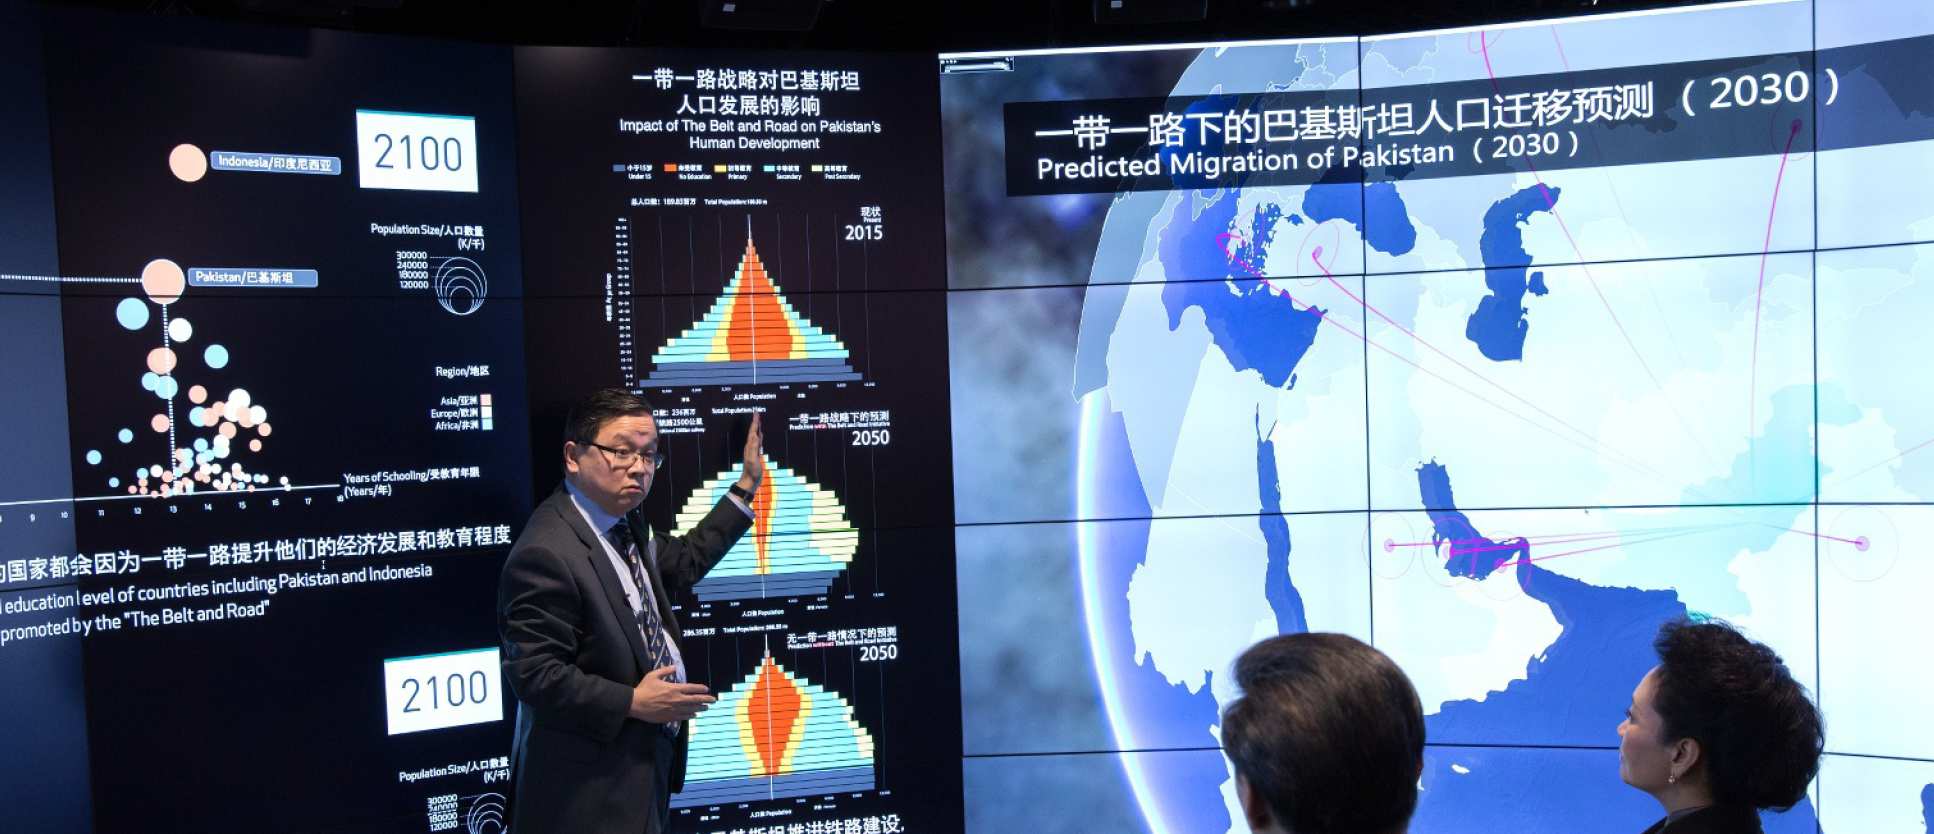
Technical Specifications
The DSI seeks to collaborate with both academic researchers and industry to develop outstanding visualisations on the Data Observatory (DO).
 We have included some software technical specifications here.
The Open Visualisation Project is hosted on GitHub (https://github.com/ove/). We currently accept contributions from everyone who signs the following Individual Contributor License Agreement (pdf file).
For the most up to date information about the capability of the DO, please contact the Open Visualisation Team at this address: ove@imperial.ac.uk.
If you are interested in using the Data Observatory, please email dsi_comms@imperial.ac.uk with your initial ideas about how you would like to make use of the Observatory.
How the DO can be used
1. Theatre Mode
Use the whole DO as a single canvass.
2. Decision Support Mode
Team in the centre of the DO with multiple simulations / outputs visible around them, allowing exploration of data and running of scenarios in real time.
3. Hackathon Mode
5 teams, eachworking on one of the 5 sections.
Hardware
- 64 full HD Samsung UD46D-P Professional Video Wall Monitors with bezels of 3.5mm between two screens
- Powered by 32 rendering nodes
- Arranged as 4 rows and 16 columns
- Height = 2.53m
- Internal diameter = 6.00m
- 313 degree surround vision
- 16 point surround sound mounted on the top of each screen stack
- Total pixel count is 132,710,400 pixels (30,720 * 4320 ) which is believed to be the largest in Europe


