Occupancy Insights

Collecting real-time, anonymised, occupancy data to develop insights which can inform resolutions to space constraints.
Please note, this project is now closed.
The College Space Sharing Programme looked at a range of ways to use our campus space more efficiently and appropriately, whilst supporting the best possible teaching and learning experience for students and staff. Part of this work was to build a picture of how our shared spaces are used.
We rolled out the software, called HubStar, which uses our WiFi technology to gather real-time anonymised data in 18 buildings on our South Kensington Campus. The software has also been installed in the Scale Space building at our White City Campus. The occupancy data from HubStar is available for members of our College community to develop insights which can inform resolutions to space constraints.
Which buildings were involved?
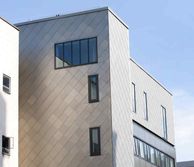
ACE Extension
ACE Extension
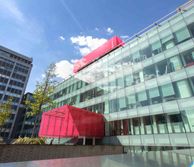
Bessemer
Bessemer
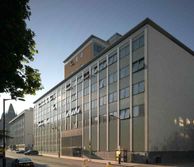
Blackett
Blackett
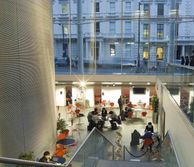
Business School
Business School
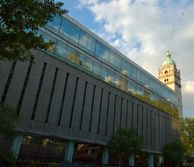
Central Library
Central Library
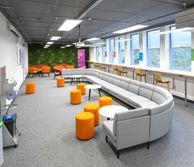
Chemistry Building Level 5 and 6
Chemistry Building Level 5 and 6
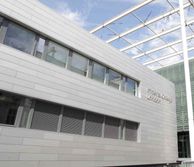
City and Guilds Building
City and Guilds Building
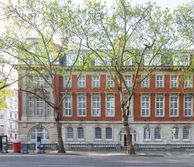
Dyson Building
Dyson Building
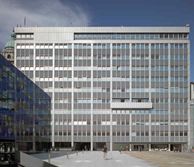
Electrical Engineering
Electrical Engineering
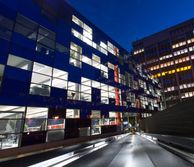
Faculty Building
Faculty Building
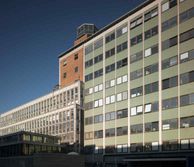
Huxley
Huxley
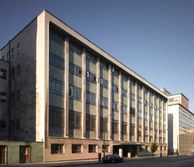
Roderic Hill
Roderic Hill
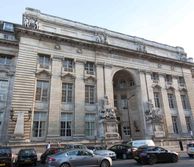
Royal School of Mines
Royal School of Mines
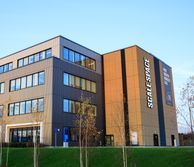
Scale Space at White City Campus
Scale Space at White City Campus
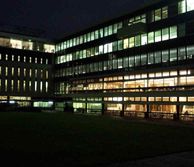
Sherfield
Sherfield
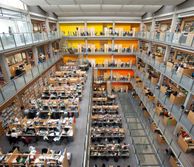
Sir Alexander Fleming
Sir Alexander Fleming
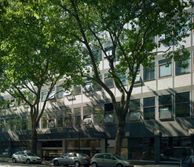
Skempton
Skempton
Weeks Hall
Weeks Hall
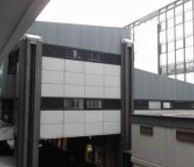
William Penney Lab
William Penney Lab
FAQ
Why did you do this?
Collecting this data has had many uses for the College such as:
- Space availability: Providing real-time information to help students find free spaces to study
- Space utilisation: Helping timetablers understand the utilisation of spaces for teaching
- Room usage: Providing insights for academics as they evolve pedagogy.
HubStar was also used to assist with the planning of the safe occupation of College space during the COVID-19 pandemic by monitoring occupancy levels across the South Kensington campus, including libraries and office areas. This data was used to inform and reassure the President’s Board along with staff and students on campus.
Longer term, it should continue to help us make the best use of our current spaces and enable us to identify opportunities for re-planning so that we can use our shared spaces more effectively and support planned growth in our student numbers.
Does this happen in other places?
Yes, collecting data of this kind is now routine in many public institutions including museums, airports, train stations and large corporations, as a way to manage space and flows of people. Real-time access to this sort of data can enable individuals to make choices about when to visit.
You may well already be familiar with the way similar data is used, for example, Google’s information on how busy a restaurant is when you search for them online.
Have you done anything like this before?
This work was built on the “automatic people counter” data gathered in a small number of our teaching spaces, which used existing sensing technologies made available across campus to count occupancy levels in the Academic Year 2016/17. These technologies were later decommissioned in the Academic Year 2018/2019 to be replaced with HubStar software, which allows the collection of data more widely across our shared spaces.
How can I get a HubStar Licence to access Occupancy Data?
To obtain a HubStar license, please raise a ticket via the ASK portal requesting one.


