Undergraduates
Where does the data come from?
![]() The Destination of Leavers Survey from Higher Education (DLHE) was superseded by a new centralised Graduate Outcomes Survey in 2018-19. This new survey had its first release of graduate employment and destination outcomes in June 2020. The release was classified by HESA as experimental data and comparison cannot be drawn to the previous DLHE information that was held.
The Destination of Leavers Survey from Higher Education (DLHE) was superseded by a new centralised Graduate Outcomes Survey in 2018-19. This new survey had its first release of graduate employment and destination outcomes in June 2020. The release was classified by HESA as experimental data and comparison cannot be drawn to the previous DLHE information that was held.
Every Higher Education institution in the UK is required to take part in the survey and provide contact details to HESA to enable them to conduct the survey. The data is collected on a rolling basis every three months capturing graduates destinations approximately 15 months after they have graduated. The survey captures both undergraduate and postgraduate activity.
The information in this section records the destination returns for the undergraduates who graduated between 1 May - 31 July 2021, 1 May – 31 July 2022 and 1 May – 31 July 2023.
What can I find in this section?
The data in this section outlines what Imperial graduates move on to following graduation including overall undergraduate destinations statistics and individual destinations data by Imperial department. The data was collected 15 months after graduating. We will continue to add new data to this section each year.
How the data is presented:
All data presented here has been subject to HESA rounding methodology in order to reduce the risk of identifying individuals from published figures. In short, the rounding methodology involves rounding all figures to the nearest 5 individuals and suppressing percentages derived from base sizes of fewer than 22.5 individuals. This may result in the information for some departments being unavailable, and in some cases, totals of 99% or 101%.
If you have any enquiries about destinations of Imperial students, please email us.
Graduate Outcomes tabs
Destination of Leavers from the Graduate Outcomes Survey (Home, EU and Overseas):
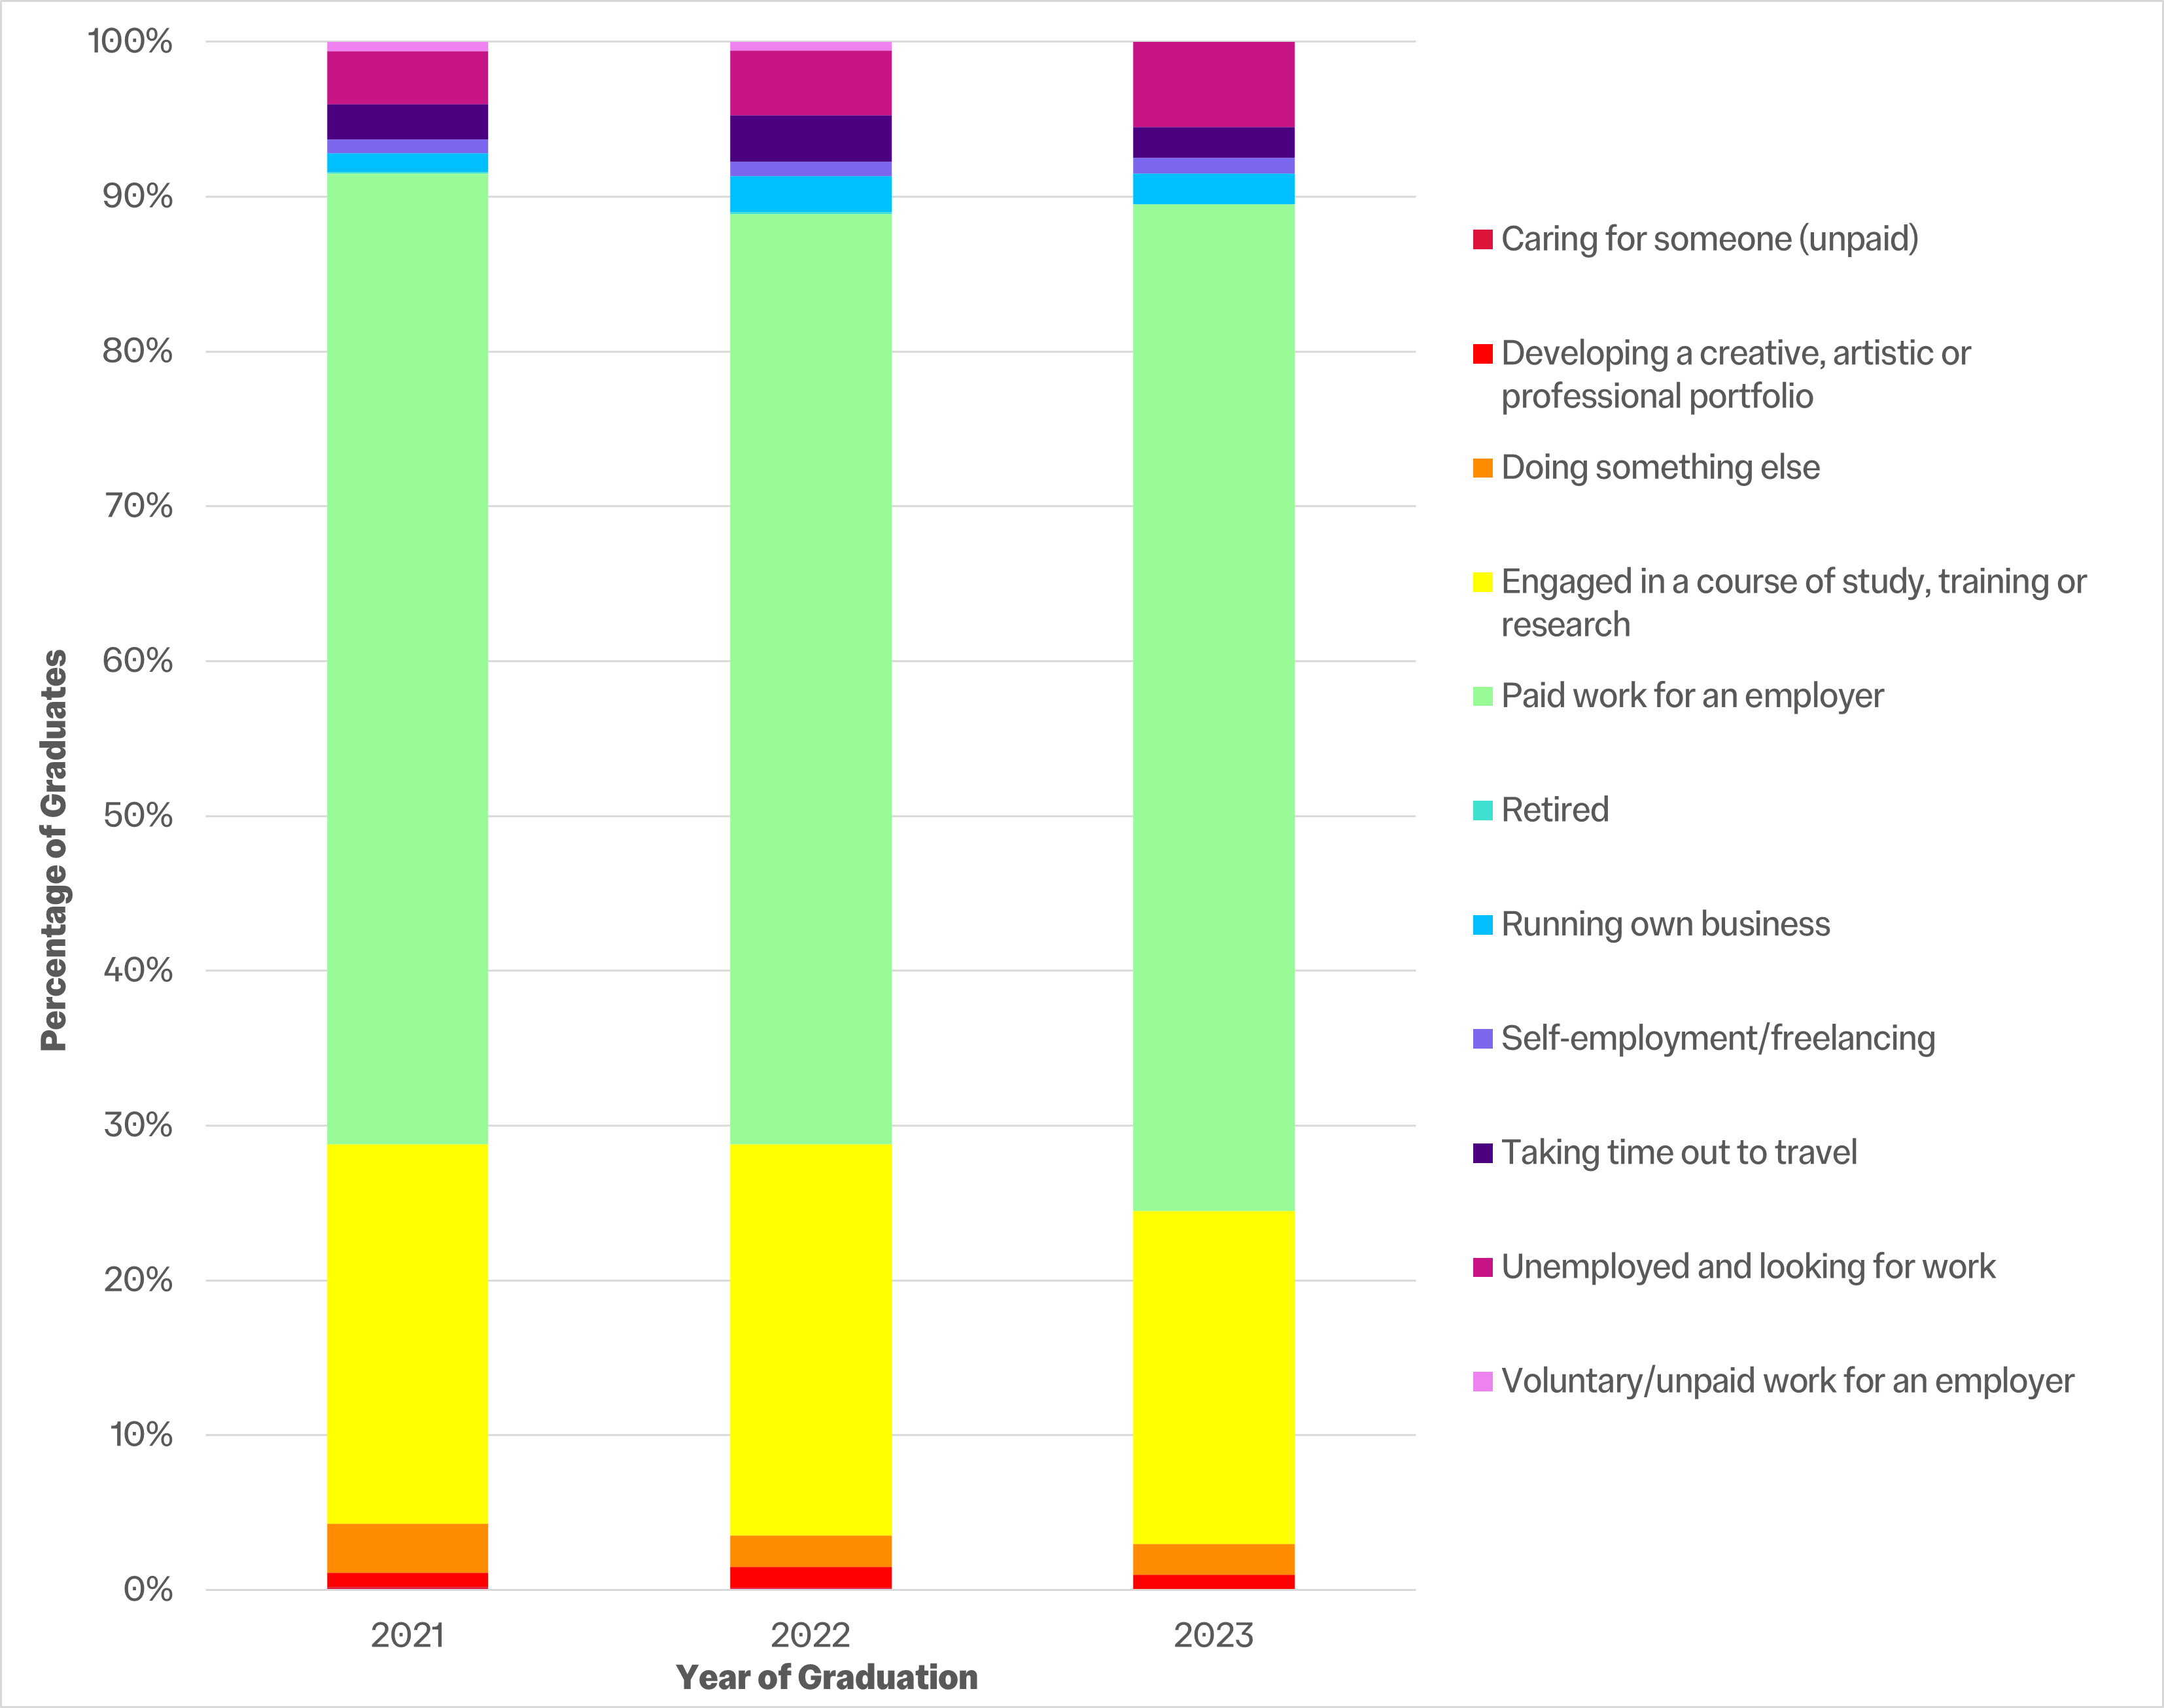
In 2023:
- 65% of all graduates had entered employment;
- 21.5% had engaged in a course of study, training or research;
- 5.5% were unemployed and looking for work;
- 2% were doing something else;
- 2% were taking time out to travel (this does not include short-term holidays);
- 1% were self-employment/freelancing;
- 0% were in voluntary/unpaid work for an employer;
- 2% were running their own business;
- 1% were developing a creative, artistic or professional portfolio;
- 0% were caring for someone (unpaid);
- 0% were retired.
Bar chart showing the results of the undergraduate collection of the new Graduate Outcomes Survey (GOS) for 2023 in comparison with 2022 and 2021 results:
Comparison of Industry Sector Entered (Home, EU and Overseas):
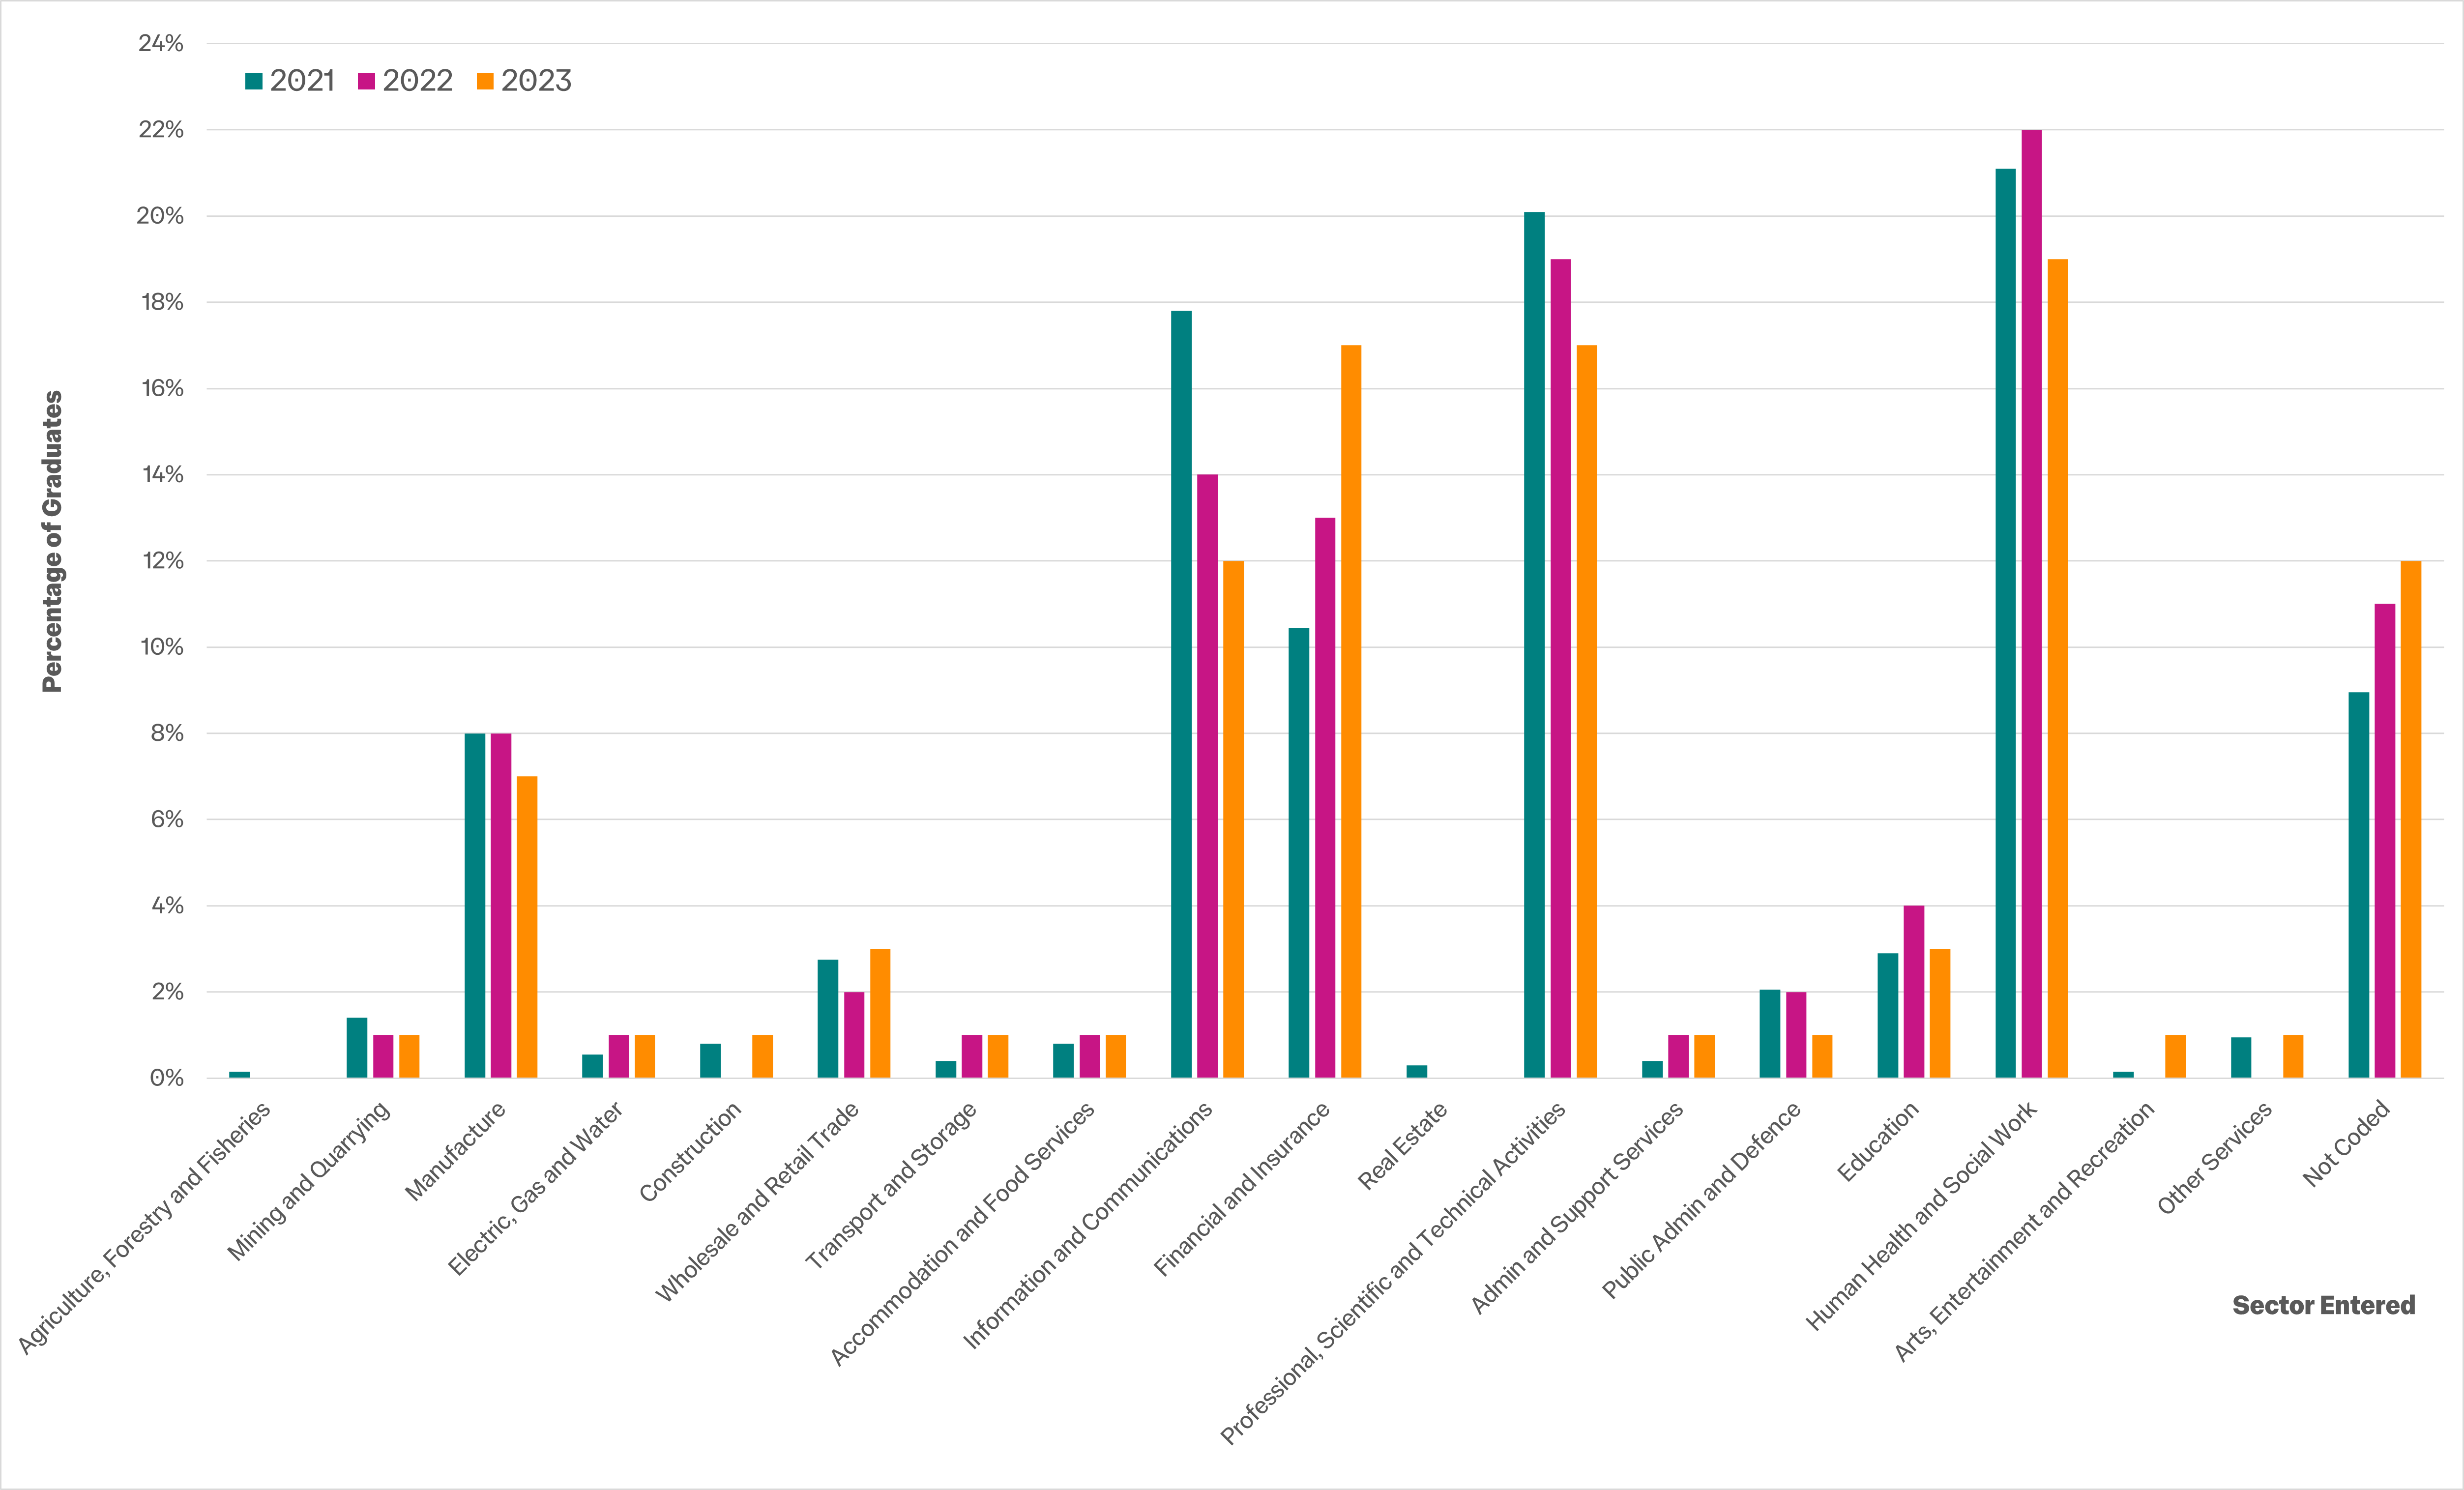
In 2023:
- 0% entered agriculture, forestry and fisheries;
- 1% entered mining and quarrying;
- 7% entered manufacture;
- 1% entered electric, gas and water;
- 1% entered construction;
- 3% entered wholesale and retail trade;
- 1% entered transport and storage;
- 1% entered accommodation and food services;
- 13% entered information and communications;
- 17% entered financial and insurance;
- 0% entered real estate;
- 17% entered professional, scientific and technical activities;
- 1% entered admin and support services;
- 1% entered public admin and defence;
- 3% entered education;
- 19% entered human health and social works;
- 1% entered arts, entertainment and recreation;
- 1% entered other services;
- 12% were not coded.
Bar chart showing the industry sectors entered by all graduates surveyed in the new Graduate Outcomes Survey (GOS) for 2023 in comparison with 2022 and 2021 results:
AERONAUTICAL ENGINEERING
- Aeronautical Engineering tables 2023 [PDF] - text-only tables for undergraduate employment statistics and destinations
BIOENGINEERING
- Bioengineering tables 2023 [PDF] - text-only tables for undergraduate employment statistics and destinations
CHEMICAL ENGINEERING
- Chemical Engineering tables 2023 [PDF] - text-only tables for undergraduate employment statistics and destinations
CHEMISTRY
- Chemistry tables 2023 [PDF] - text-only tables for undergraduate employment statistics and destinations
CIVIL ENGINEERING
- Civil Engineering tables 2023 [PDF] - text-only tables for undergraduate employment statistics and destinations
COMPUTING
- Computing tables 2023 [PDF] - text-only tables for undergraduate employment statistics and destinations
DYSON DESIGN ENGINEERING
- Design Engineering tables 2023 [PDF] - text-only tables for undergraduate employment statistics and destinations
EARTH SCIENCE AND ENGINEERING
- Data not available
ELECTRICAL & ELECTRONIC ENGINEERING
- Electrical and Electronic Engineering tables 2023 [PDF] - text-only tables for undergraduate employment statistics and destinations
LIFE SCIENCES
- Life Sciences tables 2023 [PDF] - text-only tables for undergraduate employment statistics and destinations
MATERIALS
- Data no available
MATHEMATICS
- Mathematics tables 2023 [PDF] - text-only tables for undergraduate employment statistics and destinations
MECHANICAL ENGINEERING
- Mechanical Engineering tables 2023 [PDF] - text-only tables for undergraduate employment statistics and destinations
MEDICINE
- Medicine tables 2023 [PDF] - text-only tables for undergraduate employment statistics and destinations
PHYSICS
- Physics tables 2023 [PDF] - text-only tables for undergraduate employment statistics and destinations